Az MRTG telepítése
v1.0
Kedd Július 31 9:17:16 2001
Írta: Micskó Gábor [ trey trey@debian.szintezis.hu ]
Ez a dokumentum leírja, hogyan telepítsük fel az MRTG -t Debian GNU/LiNUX -ra
Tartalom :
1.0 Mi is az az MRTG ?
2.0 A licensz
3.0 A telepítés
4.0 Az MRTG beállítása
5.0 Hogyan futtassuk az MRTG -t ?
6.0 Minták
7.0 Kapcsolódó linkek
8.0 Végszó
1.0 Mi is az az MRTG ?
A Multi Router Traffic Grapher (MRTG) egy olyan program, amellyel monitorozni tudjuk egy hálózati eszközön átmenõ forgalmat. Az MRTG a hálózati forgalomból különbözõ szempontok alapján HTML oldalakat készít, amelyekben GIF képekre rajzolja a forgalmat. Az MRTG -t perl -ben és C -ben írták, fut minden UN*X rendszeren. Én eddig Solaris 8 -on és Linux -on teszteltem minden gond nélkül. Az MRTG a müködéshez egy jól portolható perlben írt SNMP implementációt használ, ezért nem szükséges semmilyen külsö SNMP csomag. Az MRTG támogatja az új SNMPv2c 64bit -es számlálókat. Könnyen konfigurálható a hozzá adott konfigurácós eszközökkel. Kellõen gyors, mert a kritikus rutinokat átírták perl -bõl C -re. A képeket .png formátumúra készíti, ehhez a GD library -t használja.
Az MRTG -vel készíthetünk grafikont az elmúlt 5 perc átlagából (daily view) , az elmúlt 30 perc átlagából (weekly view), az elmúlt 2 óra átlagából (monthly view), és az elmúlt 1 nap átlagából (yearly view). Az MRTG nem kizárólag a Network Load -ot tudja analizálni, hanem az összes SNMP eseményt. Ha írsz hozzá külsõ modult, akkor szinte bármit monitorozhatsz : System Load, Login Session, Modem állapot, CPU terhelés, Irc szerver kihasználtság, HDD kapacitás, és még ezer dolog. A modulokat perl -ben célszerû megírni, és amint látni fogjuk nagyon egyszerûen lehet ilyen modulokat fejleszteni.
2.0 A lincensz
Az MRTG szabadon felhasználható a GNU General Public License feltételei mellett.
3.0 A telepítés
Az MRTG
A legfrissebb verziót innen töltheted le : http://ee-staff.ethz.ch/~oetiker/webtools/mrtg/pub/
Az MRTG forráskódban tölthetõ le, tehát használat elõtt le kell fordítani. Hogy ezt megtehessük szükség van egy C fordítóra (gcc) és a gépen installált perl -re.
Mivel Debian -t használunk =] szerencsénk van. A Debian tartalmaz minden eszközt a telepítéshez. Mégis ha a legújabb MRTG -re van szükséged, akkor töltsd le a fennti link -rõl.
Tehát az installálás a következõképpen történik. A megfelelõ sources.list beállítása mellett :
apt-get install mrtg
Amikre dependel:
debconf (>= 0.4.07), libsnmp-session-perl (>= 0.83), perl-modules (>= 5.6.0), perl, libc6 (>= 2.2.1-2), libgd1 (>= 1.8.3-3), libpng2, zlib1g (>= 1:1.1.3)
Ajánlott
még: mrtg-contrib, httpd | www-browser
Ezeket
kell nekünk még telepíteni. A web browser meg arra kell, hogy
a mûvünket meg is tudjuk nézni. Ha a grafikonunkat a webre is
ki szeretnénk helyezni, akkor telepítsünk egy httpd -t is (apache).
Az SNMP(d)
Ahhoz hogy használjuk kell egy SNMP daemon is. Az MRTG ugyan tartalmaz egy SNMP implementációt, én mégis azt javaslom, hogy telepítsünk egyet.
apt-get install snmpd
Amikre dependel:
libc6 (>= 2.2.2-2), libsnmp4.2 (=4.2.1-1), libwrap0
ez
a parancs feltelepíti az SNMP daemont a gépünkre. Mivel a daemon
biztosági szempontból nincs beállítva - amire fel
is hivja a figyelmünket - konfigurálnunk kell. Ezt megtehetjük
a /etc/snmp/snmpd.conf szerkesztésével.
Keressük meg ezt a részt:
###############################################################################
#
Access Control
###############################################################################
....
....
####
#
First, map the community name (COMMUNITY) into a security name
# (local and
mynetwork, depending on where the request is coming
# from):
# sec.name source community
com2sec
paranoid default public
#com2sec readonly default public
#com2sec readwrite
default private
Amint
látjuk a security alapbeállítása 'paranoid', azaz
ezzel sokmindent nem tudunk így kezdeni. Ahhoz, hogy az MRTG le tudja kérdezni,
át kell kissé írnunk:
# sec.name source community
#com2sec
paranoid default public
com2sec readonly default public
#com2sec
readwrite default private
Tehát
a default a 'com2sec readonly default public' legyen. Több jogot felesleges
adnunk. Ha átírtuk, mentsük el a config -ot, majd /etc/init.d/snmpd
restart parancsot adjuk ki bátran. Ez azért kell, hogy az új
beállítások érvényesüljenek.
Ha ez megvan minden olyan összetevõt telepítettünk amely az MRTG futtatásához, használatához kell.
4.0 Az MRTG beállítása
Az MRTG konfigurálása kicsit nehezebb dolog. Ez mindíg az adott konfigurációtól függ. Én most egy standalone gép ppp0, eth0, vmnet1 csatolóját fogom monitorozni. Természetesen az MRTG képes a ppp0, ippp0, stb. interface -ket is monitorozni. A beállítások nem sokban térnek el egymástól.
Ahhoz hogy az MRTG mûködni tudjon, szükség van egy mrtg.cfg file -ra (lehet más is a neve). Ezt általában a /etc/mrtg.cfg helyen találod. De ez az installálás utan még nem létezik, neked kell legyártani. Ehhez a 'cfgmaker' nevû programot fogjuk használni, amelyet az MRTG -vel szállítanak. Az elsõ dolog a router -ünk (server -ünk) Target -jét meghatározzuk. A Target mondja meg az MRTG -nek mit is kell monitorozni. Pl:
Target[valamigep.valahol.hu]: 2:public@valamigep.valahol.hu
Tehát:
cfgmaker 2:public@195.56.26.224 >> mrtg.cfg
ezzel a configfile jó esetben el is készült. Itt az IP cím a ppp0 interface IP -je.
Egy példa az mrtg.cg -re:
---------------------------------X----X-----------------------------------
WorkDir:
/var/www/mrtg
WriteExpires: Yes
######################################################################
#
System: sunshine
# Description: Linux sunshine 2.4.6 #2 Sun Jul 8 13:46:40
CEST 2001 i686
# Contact: Root <root@localhost> (configure /etc/snmp/snmp.local.conf)
#
Location: Unknown (configure /etc/snmp/snmp.local.conf)
######################################################################
###
Interface 1 >> Descr: 'lo' | Name: '' | Ip: '127.0.0.1' | Eth: '' ###
###
The following interface is commented out because:
### * it is a Software Loopback
interface
#
# Target[195.56.26.224_1]: 1:public@195.56.26.224:
# SetEnv[195.56.26.224_1]:
MRTG_INT_IP="127.0.0.1" MRTG_INT_DESCR="lo"
# MaxBytes[195.56.26.224_1]:
1250000
# Title[195.56.26.224_1]: Traffic Analysis for 1 -- sunshine
# PageTop[195.56.26.224_1]:
<H1>Traffic Analysis for 1 -- sunshine</H1>
# <TABLE>
#
<TR><TD>System:</TD> <TD>sunshine in Unknown (configure
/etc/snmp/snmp.local.conf)</TD></TR>
# <TR><TD>Maintainer:</TD>
<TD>Root <root@localhost> (configure /etc/snmp/snmp.local.conf)</TD></TR>
#
<TR><TD>Description:</TD><TD>lo </TD></TR>
#
<TR><TD>ifType:</TD> <TD>softwareLoopback (24)</TD></TR>
#
<TR><TD>ifName:</TD> <TD></TD></TR>
# <TR><TD>Max
Speed:</TD> <TD>1250.0 kBytes/s</TD></TR>
# <TR><TD>Ip:</TD>
<TD>127.0.0.1 (trey.hu)</TD></TR>
# </TABLE>
###
Interface 2 >> Descr: 'eth0' | Name: '' | Ip: '10.0.0.1' | Eth: '00-08-c7-ea-7a-4b'
###
Target[195.56.26.224_2]:
2:public@195.56.26.224:
SetEnv[195.56.26.224_2]: MRTG_INT_IP="10.0.0.1"
MRTG_INT_DESCR="eth0"
MaxBytes[195.56.26.224_2]: 1250000
Title[195.56.26.224_2]:
Traffic Analysis for 2 -- sunshine
PageTop[195.56.26.224_2]: <H1>Traffic
Analysis for 2 -- sunshine</H1>
<TABLE>
<TR><TD>System:</TD>
<TD>sunshine in Unknown (configure /etc/snmp/snmp.local.conf)</TD></TR>
<TR><TD>Maintainer:</TD>
<TD>Root <root@localhost> (configure /etc/snmp/snmp.local.conf)</TD></TR>
<TR><TD>Description:</TD><TD>eth0
</TD></TR>
<TR><TD>ifType:</TD> <TD>ethernetCsmacd
(6)</TD></TR>
<TR><TD>ifName:</TD> <TD></TD></TR>
<TR><TD>Max
Speed:</TD> <TD>1250.0 kBytes/s</TD></TR>
<TR><TD>Ip:</TD>
<TD>10.0.0.1 (sunshine.trey.hu)</TD></TR>
</TABLE>
### Interface 3 >> Descr: 'vmnet1' | Name: '' | Ip: '10.0.0.2' | Eth: '00-50-56-01-00-00' ###
Target[195.56.26.224_3]:
3:public@195.56.26.224:
SetEnv[195.56.26.224_3]: MRTG_INT_IP="10.0.0.2"
MRTG_INT_DESCR="vmnet1"
MaxBytes[195.56.26.224_3]: 1250000
Title[195.56.26.224_3]:
Traffic Analysis for 3 -- sunshine
PageTop[195.56.26.224_3]: <H1>Traffic
Analysis for 3 -- sunshine</H1>
<TABLE>
<TR><TD>System:</TD>
<TD>sunshine in Unknown (configure /etc/snmp/snmp.local.conf)</TD></TR>
<TR><TD>Maintainer:</TD>
<TD>Root <root@localhost> (configure /etc/snmp/snmp.local.conf)</TD></TR>
<TR><TD>Description:</TD><TD>vmnet1
</TD></TR>
<TR><TD>ifType:</TD> <TD>ethernetCsmacd
(6)</TD></TR>
<TR><TD>ifName:</TD> <TD></TD></TR>
<TR><TD>Max
Speed:</TD> <TD>1250.0 kBytes/s</TD></TR>
<TR><TD>Ip:</TD>
<TD>10.0.0.2 ()</TD></TR>
</TABLE>
###
Interface 4 >> Descr: 'ppp0' | Name: '' | Ip: '195.56.26.224' | Eth: ''
###
### The following interface is commented out because:
### * has a speed
of 0 which makes no sense
#
# Target[195.56.26.224_4]: 4:public@195.56.26.224:
#
SetEnv[195.56.26.224_4]: MRTG_INT_IP="195.56.26.224" MRTG_INT_DESCR="ppp0"
#
MaxBytes[195.56.26.224_4]: 0
# Title[195.56.26.224_4]: Traffic Analysis for
4 -- sunshine
# PageTop[195.56.26.224_4]: <H1>Traffic Analysis for 4
-- sunshine</H1>
# <TABLE>
# <TR><TD>System:</TD>
<TD>sunshine in Unknown (configure /etc/snmp/snmp.local.conf)</TD></TR>
#
<TR><TD>Maintainer:</TD> <TD>Root <root@localhost>
(configure #/etc/snmp/snmp.local.conf)</TD></TR>
# <TR><TD>Description:</TD><TD>ppp0
</TD></TR>
# <TR><TD>ifType:</TD> <TD>ppp
(23)</TD></TR>
# <TR><TD>ifName:</TD> <TD></TD></TR>
#
<TR><TD>Max Speed:</TD> <TD>0.0 Bytes/s</TD></TR>
#
<TR><TD>Ip:</TD> <TD>195.56.26.224 (gyor-1.dialin.datanet.hu)</TD></TR>
#
</TABLE>
Target[localhost.cpu]:
`/home/trey/cpuinfo.pl`
MaxBytes[localhost.cpu]: 100
Options[localhost.cpu]:
gauge, nopercent
Unscaled[localhost.cpu]: dwym
YLegend[localhost.cpu]: %
of CPU used
ShortLegend[localhost.cpu]: %
LegendO[localhost.cpu]: CPU
System:
LegendI[localhost.cpu]: CPU User:
Title[localhost.cpu]:
localhost.cpu name
PageTop[localhost.cpu]: <H1>CPU usage for localhost.cpu
name</H1>
<TABLE>
<TR><TD>System:</TD> <TD>Debian
GNU/LiNUX 2.2</TD></TR>
<TR><TD>Maintainer:</TD>
<TD>System administrator</TD></TR>
<TR><TD>Description:</TD><TD>Intel
Pentium III</TD></TR>
<TR><TD>Ip:</TD> <TD>localhost
(debian)</TD></TR>
</TABLE>
---------------------------------X----X-----------------------------------
Ahol a 'WorkDir: /var/www/mrtg' ahova az MRTG dolgozik. A configfile elsõ szakaszában a 'lo' azaz localhost -ot monitorozza, aztán az 'eth0' , vmnet1, ppp0, és vépül egy külsõ modul segítségével a gép CPU terhelését. Itt jól látható, hogy miként tudunk egy általunk írt modult futtatni. A `/home/trey/cpuinfo.pl` egy perl script amit nekünk kell megírni, vagy beszerezni.
---------------------------------X----X-----------------------------------
#!/usr/bin/perl
#
Script modified by trey
# Succesfully tested on this systems:
# Solaris8
x86
# Debian GNU/Linux 2.2potato, 2.3 Woody unstable
#========================================================
#
CPU Usage script for mrtg
#
# File: cpuinfo.pl
# Author: Matthew Schumacher
| schu@7x.com
# Version: 1.0
#
# Date: 10/15/1999
# Purpose: This
script reports CPU usage for user
# and system to mrtg, along with uptime
#
and the machine's hostname.
#
# Usage: ./cpuinfo.pl {machine} {os}
#
#
For now {os} can only be "sun" or "linux"
#
# If you
would like to hard code defaults
# then enter them below.
#
# Info: Designed
on RedHat linux 6.0 with perl
# version 5.004_04. The script itself has
#
only been tested on Linux, however, it
# has been tested to connect to, and
graph
# CPU usage on sun (solaris 7) and linux.
#
# This script requires
both sar and rsh to
# be installed and working. Because linux
# does not
come with sar (mine didn't) it
# may be necessary to download and install
#
it. Get it here:
#
# ftp://metalab.unc.edu/pub/Linux/system/status/sysstat-2.0.tar.gz
#
#
# How it works:
#
# The script uses rsh to run sar on the
the
# remote machine. Sar samples the cpu time
# for both user and system
once per second
# for 10 seconds. It then reports an average
# to the script,
which parses out the information
# and formats it in a way mrtg can understand.
#
The script also runs uptime to get the machine's
# uptime and passes it to
mrtg.
#
# [Note to User]
#
# If anyone has comments or suggestions,
email me at
# schu@7x.com and I'll try to get back to you :)
#
# -------------------------------------------------------------
#
#
Sample cfg:
#
# Target[machine]: `./cpuinfo.pl`
# MaxBytes[machine]:
100
# Options[machine]: gauge, nopercent
# Unscaled[machine]: dwym
#
YLegend[machine]: % of CPU used
# ShortLegend[machine]: %
# LegendO[machine]:
CPU System:
# LegendI[machine]: CPU User:
# Title[machine]:
Machine name
# PageTop[machine]: <H1>CPU usage for Machine name
#
</H1>
# <TABLE>
# <TR><TD>System:</TD><TD>Machine
name</TD></TR>
# </TABLE>
#
# --------------------------------------------------------------
#
# Ok, we are now done with the notes :)
#
#========================================================
#
setup local vars
my($machine, $os);
#=======================================================
#
== Enter your default machine name and os here ==
$machine
= "195.56.253.245"; # Enter machine to monitor here
$os = "sun";
# Currently there is only linux and sun
#
== You shouldn't need to edit anything below this line ==
#========================================================
# This allows command args to override defaults listed above
if
(scalar(@ARGV) > 2)
{
print("USAGE: cpuinfo.pl {machine} {os}\n");
exit(-1);
}
if
($ARGV[0] ne '' && $ARGV[0] ne '#')
{
$machine = $ARGV[0];
}
if ($ARGV[1] ne
'' && $ARGV[1] ne '#')
{
$os = $ARGV[1];
}
# Validate the os
SWITCH:
{
if ($os =~ /^sun$/){last SWITCH;}
if ($os =~ /^linux$/){last SWITCH;}
# DEFAULT: Die if we can't figure out what the os is
die "Can't figure
out which OS the machine is.\n";
}
#
Execute the appropriate subroutine based on the os
&$os;
exit(0);
#=======================================================
#
Subroutines: names of subroutines are supported OSs.
#========================================================
sub
sun
{
# Run
commands
# $getcpu = `rsh $machine "sar -u 1 10" | grep Average`;
#
$getuptime = `rsh $machine "uptime"`;
$getcpu = `sar -u 1 40 | grep Average`;
$getuptime = `uptime`;
#
Parse though getcpu and get data
$getcpu =~ /^Average\s+(\d+)\s+(\d+)\s+/;
$outputusr = $1;
$outputsys = $2;
# Print getcpu data for mrtg
print $outputusr."\n";
print $outputsys."\n";
# Parse though getuptime and get data
$getuptime =~ /^\s+(\d{1,2}:\d{2}..)\s+up\s+(\d+)\s+(......),/;
# Print getuptime data for mrtg
print $2." ".$3."\n";
# Print machine
name for mrtg
print $machine."\n";
}
sub linux
{
# Run commands
# $getcpu = `rsh $machine "/usr/local/bin/sar
-u 1 10 | grep "Average:""`;
# $getuptime = `rsh $machine "/usr/bin/uptime"`;
$getcpu = `/usr/local/bin/sar -u 1 10 | grep "Average:"`;
$getuptime
= `/usr/bin/uptime`;
# Parse though getcpu and get data
$getcpu =~ /^Average:\s+(\d+).(\d+)%\s+(\d+).(\d+)%\s+(\d+).(\d+)%\s+(\d+).(\d+)%/;
$getcpuusr = $1;
$getcpusys = $5;
# Print getcpu data for mrtg
print $getcpuusr."\n";
print $getcpusys."\n";
# Parse though getuptime and get data
$getuptime =~ /^\s+(\d{1,2}:\d{2}..)\s+up\s+(\d+)\s+(\w+),/;
# Print getuptime data for mrtg
print $2." ".$3."\n";
# Print machine name for mrtg
print $machine."\n";
}
---------------------------------X----X-----------------------------------
5.0 Hogyan futtassuk az MRTG -t ?
Mivel szeretnénk ha a Network Load -ot, CPU terhelést, stb. folyamatosan nyomon követhetnénk (csak ennek van értelme), szükséges az MRTG -t crontab - ba tenni (lehet daemon -ként is futtatni ehhez olvasd el a /usr/doc/mrtg könyvtárban levõ dokumentációt. Meg amúgyis : RTFM).
editáljuk a /etc/crontab file -t, és irjuk bele az alábbi sort:
5,10,15,20,25,30,35,40,45,50,55 * * * * /usr/bin/mrtg /etc/mrtg.cfg > /dev/null 2>&1
Ez azt teszi hogy minden nap, minden ötödik percben lefuttatja az MRTG -t, és elkészíti a grafikonokat.
6.0 Minták
Itt két mintát láthatsz az MRTG kimenetébõl. Mielõtt valaki összefüggést keresne a fennti configfile, és az itt látható képek között, elmondom, hogy ezek a képek nem a fennti configfile alapján készültek =).
| System: | SunOS 5.8 aka. Solaris 8 |
| Maintainer: | System administrator |
| Description: | iprb0 |
| ifType: | ethernetCsmacd (6) |
| ifName: | Intel 100pro/Compaq Netelligent |
| Max Speed: | 17.0 kBytes/s |
| Ip: | 195.56.253.245 (debian) |
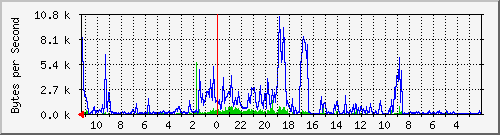
| Max In: | 5675.0 B/s (33.4%) | Average In: | 205.0 B/s (1.2%) | Current In: | 360.0 B/s (2.1%) | ||
| Max Out: | 10.5 kB/s (61.9%) | Average Out: | 1024.0 B/s (6.0%) | Current Out: | 7691.0 B/s (45.2%) |
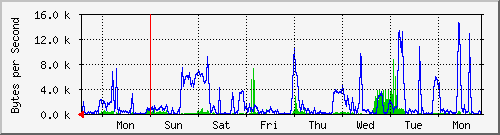
| Max In: | 8898.0 B/s (52.3%) | Average In: | 471.0 B/s (2.8%) | Current In: | 61.0 B/s (0.4%) | ||
| Max Out: | 14.7 kB/s (86.2%) | Average Out: | 1769.0 B/s (10.4%) | Current Out: | 390.0 B/s (2.3%) |
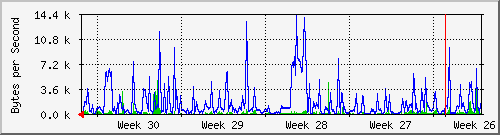
| Max In: | 4997.0 B/s (29.4%) | Average In: | 318.0 B/s (1.9%) | Current In: | 69.0 B/s (0.4%) | ||
| Max Out: | 14.2 kB/s (83.7%) | Average Out: | 1596.0 B/s (9.4%) | Current Out: | 209.0 B/s (1.2%) |
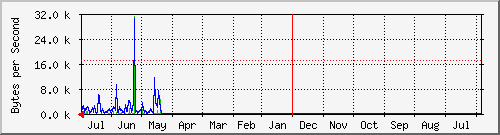
| Max In: | 31.4 kB/s (184.5%) | Average In: | 846.0 B/s (5.0%) | Current In: | 246.0 B/s (1.4%) | ||
| Max Out: | 30.6 kB/s (180.2%) | Average Out: | 2277.0 B/s (13.4%) | Current Out: | 1194.0 B/s (7.0%) |
| GREEN ### | Incoming Traffic in Bytes per Second |
| BLUE ### | Outgoing Traffic in Bytes per Second |
| version 2.9.10 | Tobias Oetiker <oetiker@ee.ethz.ch> and Dave Rand <dlr@bungi.com> |
| System: | SunOS 5.8 aka. Solaris 8 |
| Maintainer: | System administrator |
| Description: | Intel Pentium Pro 200 dual |
| Ip: | 195.56.253.245 (debian) |
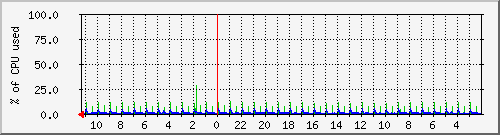
| Max CPU User: | 29.0 % | Average CPU User: | 3.0 % | Current CPU User: | 1.0 % | ||
| Max CPU System: | 5.0 % | Average CPU System: | 1.0 % | Current CPU System: | 1.0 % |
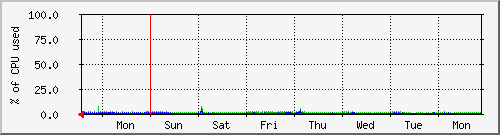
| Max CPU User: | 8.0 % | Average CPU User: | 1.0 % | Current CPU User: | 2.0 % | ||
| Max CPU System: | 4.0 % | Average CPU System: | 0.0 % | Current CPU System: | 1.0 % |
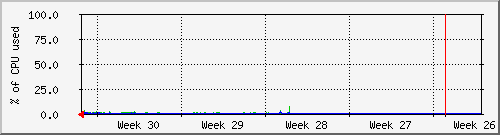
| Max CPU User: | 8.0 % | Average CPU User: | 1.0 % | Current CPU User: | 2.0 % | ||
| Max CPU System: | 2.0 % | Average CPU System: | 0.0 % | Current CPU System: | 1.0 % |
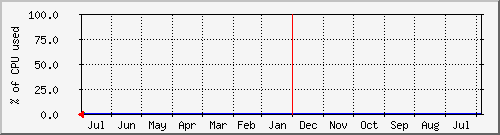
| Max CPU User: | 2.0 % | Average CPU User: | 1.0 % | Current CPU User: | 2.0 % | ||
| Max CPU System: | 0.0 % | Average CPU System: | 0.0 % | Current CPU System: | 0.0 % |
| GREEN ### | Incoming Traffic in Bytes per Second |
| BLUE ### | Outgoing Traffic in Bytes per Second |
| version 2.9.10 | Tobias Oetiker <oetiker@ee.ethz.ch> and Dave Rand <dlr@bungi.com> |
7.0 Kapcsolódó linkek
Az MRTG hivatalos honlapja: http://ee-staff.ethz.ch/~oetiker/webtools/mrtg/mrtg.html
Az MRTG FAQ oldalát itt találod: http://faq.mrtg.org/
Hogyan mûködik az SNMP? A választ itt találod: http://www.develnet.es/~david/papers/snmp/
8.0 Végszó
Ennyit röviden az MRTG telepítésérõl, természetesen ez a leírás a minimális lehetõségeket ismerteti. Amennyiben extra kívnánságod van, látogass el az MRTG oldalára, és olvasd el a dokumentációt. A weboldalon nagyon jól dokumentálva van minden.
Ha valami kérdésed, vagy építõ jellegû kritikád van : trey@debian.szintezis.hu
Sok szerencsét.